Lab 5:
Bioinformatics
PRE-LAB CONCEPTS
Phylogenetics
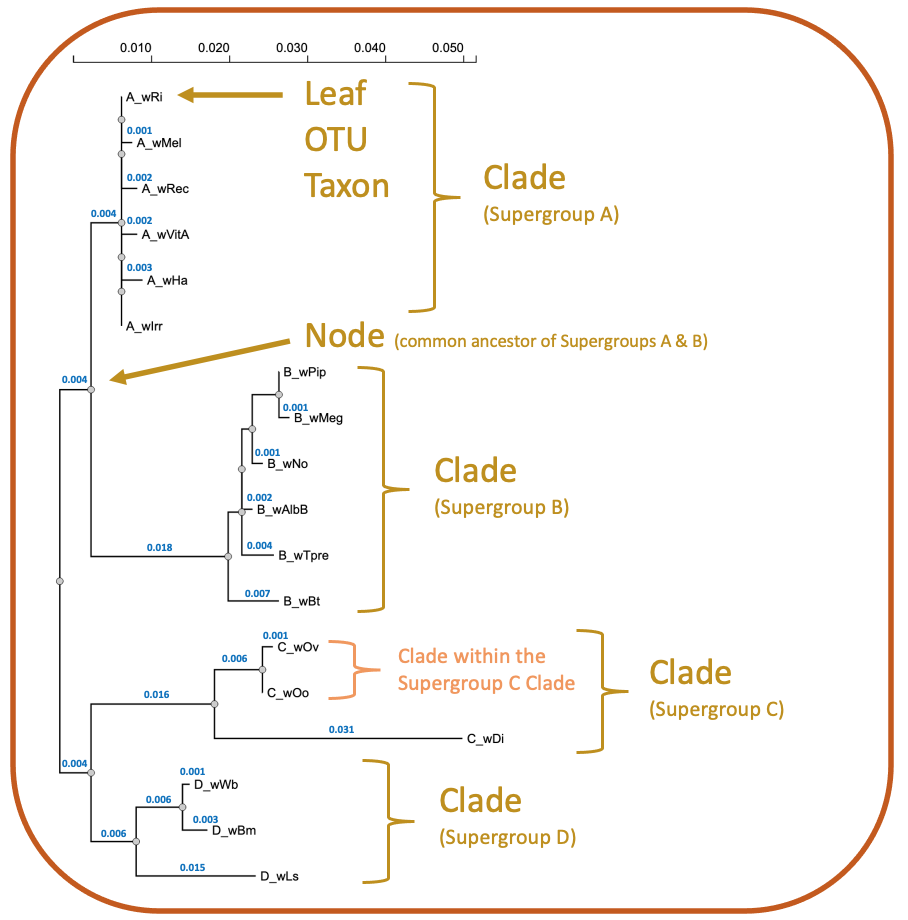
Phylogenetics is the study of evolutionary relatedness among biological organisms. Phylogenetic trees are generally based on molecular data (DNA or amino acid sequence) and use tree-like branching patterns to illustrate evolutionary histories, as shown below for Wolbachia. The tips of each branch, often referred to as leaves, represent the operational taxonomic units (OTUs) that are being compared. These might include genes, individuals, species, or populations. If the OTUs represent a formal taxonomic group, such as a species, they are termed taxa (singular: taxon). Each node on the tree represents the common ancestor for all taxa branching out of that node. Clusters of taxa that originate from the same ancestral node are called clades.
Types of Trees
Rooted trees feature a distinct node, or root, that serves as the ancestral group for all taxa in the tree. The most common way to root a tree is by using an ancestral outgroup, a taxon that is known to be more distantly related than all other taxa in the tree. Unrooted trees, however, are necessary when ancestry is unknown (Fig 1). In the case of Wolbachia Supergroups, the ancestral strain is unknown so most trees will be unrooted. We can, however, include genera such as Ehrlichia or Anaplasma as outgroups because they are closely related yet outside the group of interest (Wolbachia). While this may not provide concise ancestral information (a true root), it will create a meaningful tree showing the relationship of all Wolbachia taxa relative to closely related taxa (Fig 2). Finally, unrooted trees are sometimes midpoint rooted (Fig 3). The hypothetical root can be placed midpoint in the tree if (i) the tree is balanced, and closely related clades are separated by a long branch or (ii) taxa are evolving at the same rate.

Alignments
The length of each branch on a phylogenetic tree represents the evolutionary distance between sequences. There are various approaches to constructing phylogenetic trees based on the dataset being analyzed; many methods begin with a distance estimation between nucleotide or amino acid sequences. The first step in distance-based phylogeny is the calculation of the pairwise distance, or p-distance, between two sequences. In simplest forms, this can be calculated by aligning two DNA sequences and dividing the number of nucleotide differences (nd) by sequence length, or the total number of nucleotide sites in the sequence (n).
p = nd/n
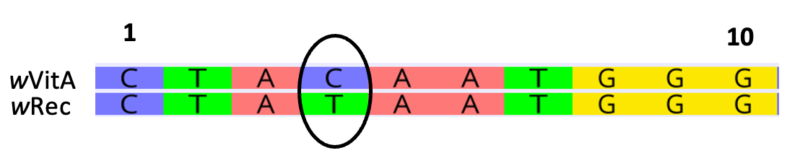
In the example below, there is one base pair substitution (C – T) across 10 nucleotide sites.
p = 1/10 = 0.10
Typically, an alignment would assess multiple sequences, each with hundreds to thousands of nucleotides.
A higher p-distance (e.g., 0.30) would indicate that the sequences are more divergent, or different, relative to the above pairwise alignment. On the other hand, a p-distance of 0 would indicate that the sequences are identical with 100% nucleotide similarity.
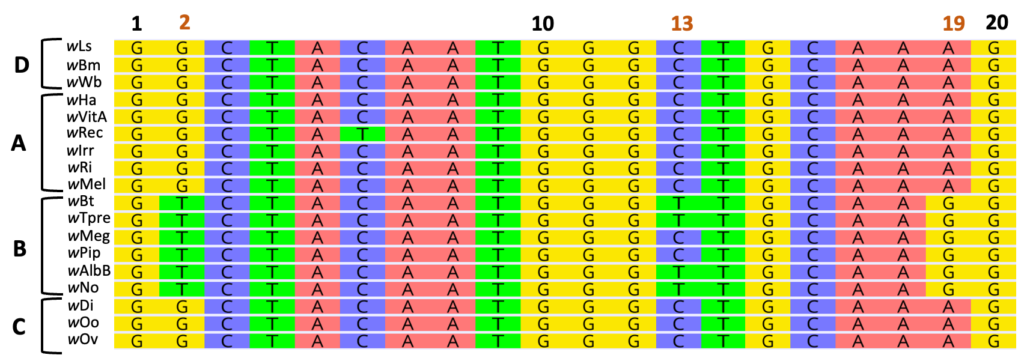
The above alignment features representatives from four Wolbachia Supergroups (labeled A-D). Within the B-Supergroup, notice unique base pair substitutions at positions 2 and 19 relative to all other Supergroups. These mutations, or changes in the DNA sequence, are specific to the B-Supergroup. Position 13, however, is variable within Supergroup B.
Point Mutations
Beyond the basic p-distance, many other variables in an alignment can inform evolutionary analyses. For example, point mutations are genetic mutations in which a single nucleotide in a genome is altered. Nucleotides can be substituted, inserted, or deleted in a genome.
Nucleotide Substitutions
Transitions involve the interchange of a purine with a purine (A ⇄ G) or a pyrimidine with a pyrimidine (C ⇄ T). Transversions, on the other hand, involve the interchange of a purine and a pyrimidine. As shown in the figure below, transversions have a greater impact on genomic structure because a two-ring structure is exchanged with a one-ring structure, or vice versa.
![]()
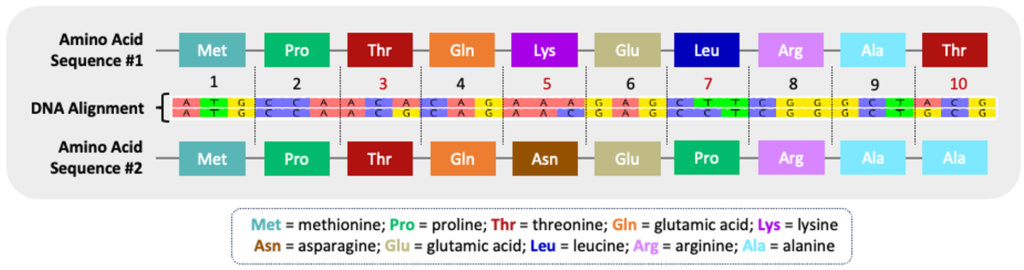
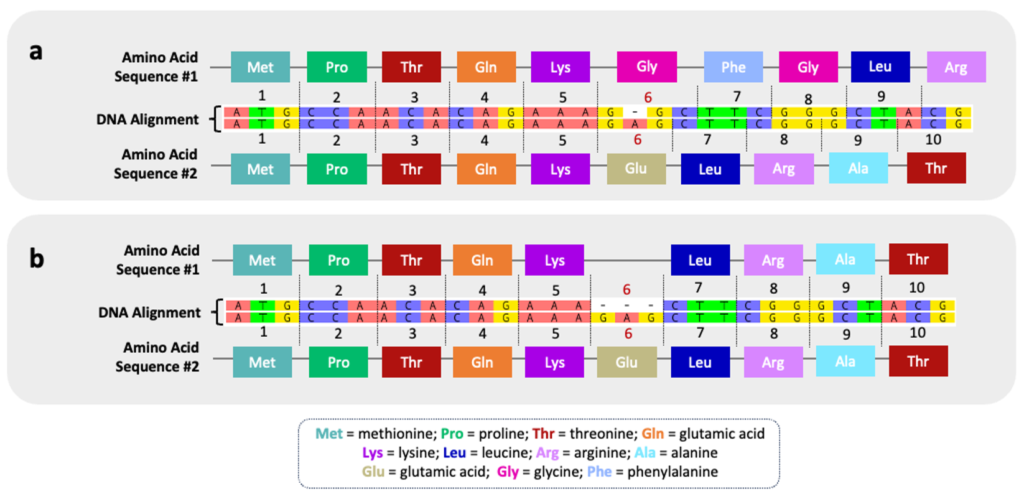
Both types of nucleotide substitutions – transitions and transversions – can influence the resulting protein sequence. Nonsynonymous substitutions are point mutations resulting in a different amino acid sequence. If the point mutation encodes the same amino acid, it is termed a synonymous substitution. The figure below illustrates the variation in amino acid sequences encoded by two different DNA sequences. Each codon, a sequence of three nucleotides that correlates to a specific amino acid, is marked #1-10 (see Codon Table tab). Codon #3 encodes a synonymous substitution because the correlating amino acid, threonine (Thr), remains the same even though the coding sequences are slightly different (ACA vs ACG) between the two nucleotide sequences. Codons #5, #7, and #10, however, encode nonsynonymous substitutions because the change in nucleotide sequence has an impact on the resulting amino acid products. A simple change in the amino acid sequence can impact both the structure and function of the resulting protein.
Nucleotide Insertions & Deletions
Insertions and deletions in a nucleotide alignment are often referred to as indels (insertions-deletions) because the term does not require information about the direction of mutation. When comparing two nucleotide sequences, for example, it is likely unknown if the indel is due to an insertion (gain of a nucleotide) in one sequence or a deletion (loss of a nucleotide) in the aligned sequenced. Indels are incredibly important to evolutionary genetics because they influence phenotypic traits, including human disease.
Indels will result in a frameshift mutation unless all three nucleotides in a codon are similarly inserted or deleted. As the term implies, the reading frame of the nucleotide sequence is shifted such that the amino acid sequence is altered. The figure below illustrates an indel at codon #6. Without comprehensive phylogenetic information, it is unknown whether this indel represents a deletion in the top sequence or an insertion in bottom sequence. In scenario (a), a single indel has drastic consequences for the downstream amino acid sequence and will result in a different protein product. In scenario (b), the insertion/deletion of an entire codon (3 nucleotides) results in only one amino acid change across the sequence. The phenotypic impact of this seemingly minor indel will depend on the specific role of the amino acid (glutamic acid) in overall structure and/or function of the protein.
Together, point mutations occur at different evolutionary rates and have profoundly different impacts on the genome. When building phylogenetic trees, bioinformaticians must weigh the cost/benefit of using an advanced method with long computational time that better accounts for evolutionary variation vs. a simpler, less robust method that delivers fast results. For the purpose of this lab, we will focus on the latter.
Codon Table
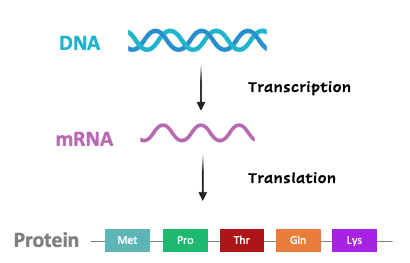
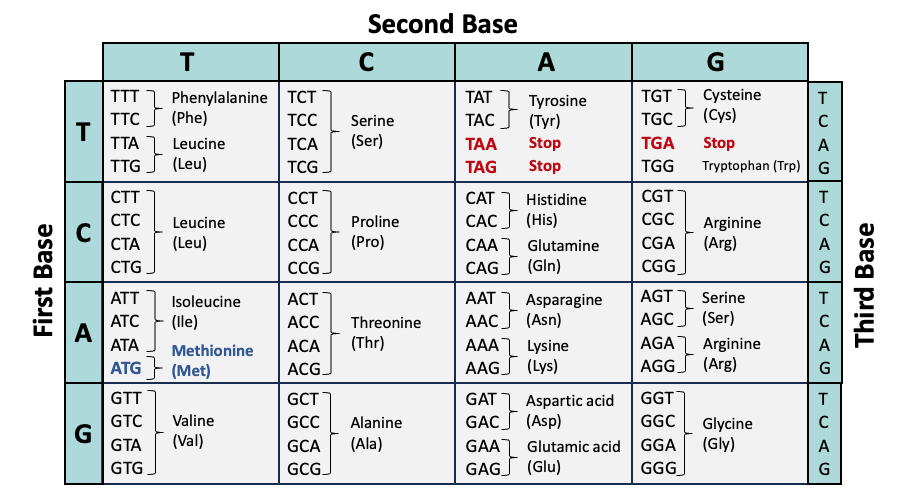
The genetic code of DNA is transcribed into messenger RNA (mRNA) and then translated into proteins via codons, three consecutive nucleotides that correlate to specific amino acids. The table below summarizes the association between codons (from the coding strand of DNA) and amino acids.
- ATG (methionine) is the most common start codon; therefore, methionine is often the first amino acid in a protein sequence.
- TAA, TAG, and TGA encode stop codons. This terminates translation of the protein. If a frameshift mutation prematurely encodes a stop codon, the protein will be truncated.
- Many codon tables display the genetic code from mRNA to amino acid (translation). In this case, thymine (T) would be replaced with uracil (U).
- The genetic code is nearly universal across all forms of life. Some organisms, such as bacteria, feature slight deviations in the genetic code and may utilize alternative start codons.
Sanger Sequencing Files
The phylogenetic trees constructed in this lab activity are based on the insect barcoding gene, mitochondrial cytochrome c oxidase I (CO1). All sequences have been obtained by DNA extractions from individual arthropods followed by Sanger sequencing. A few simple steps, covered in Activity 2, are needed to convert the raw data file (.ab1) to a usable format (.fasta) for phylogenetic analysis. Before we begin, let’s review some basic concepts:
File Extensions
A file extension typically comes after the period in a file name and indicates the format and/or software program that generated the file. Below are a few common bioinformatics file extensions:
- .ab1 (ABI sequencer data file): Known as the trace file, it includes raw data that has been output from Applied Biosystems’ Sequencing Analysis Software. .ab1 files include quality information about the base calls, the chromatogram (also called the electropherogram), and the DNA sequence.
- .scf (Standard Chromatogram Format): Like .ab1 files, .scf files are also trace files that include quality information about the base calls, the chromatogram (also called the electropherogram), and the DNA sequence.
- .fasta: A text-based format for representing either nucleotide or amino acid sequences. The file often starts with a description or header line that begins with ‘>’ and provides information about the sequence.
Chromatograms
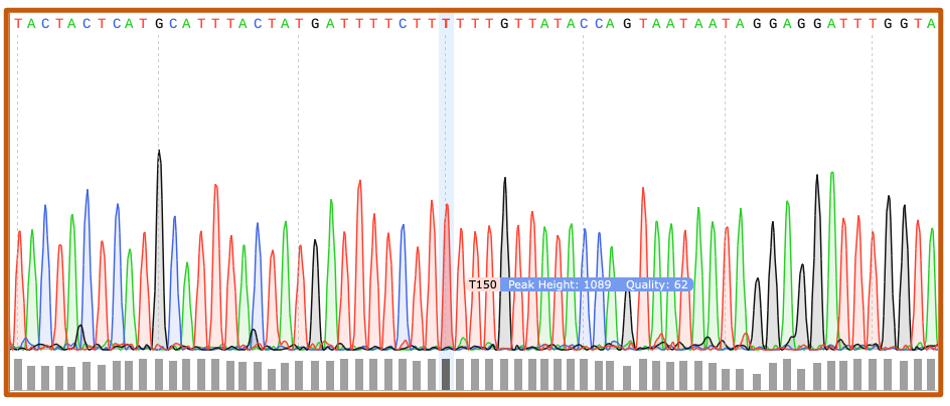
Sanger sequencing (.ab1) files are visualized as chromatograms. Each peak corresponds with a unique base call, or nucleotide, and quality score. Chromatograms can be trimmed and modified to generate a text-based FASTA file.
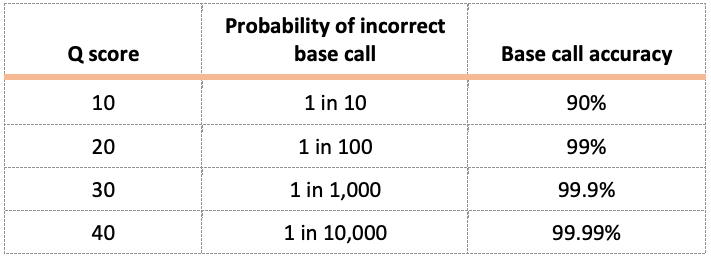
Quality Scores
Quality scores indicate the probability that an individual base, or nucleotide, is called incorrectly during DNA sequencing. For this lab, we recommend a Q score ≥ 40.
FASTA Files
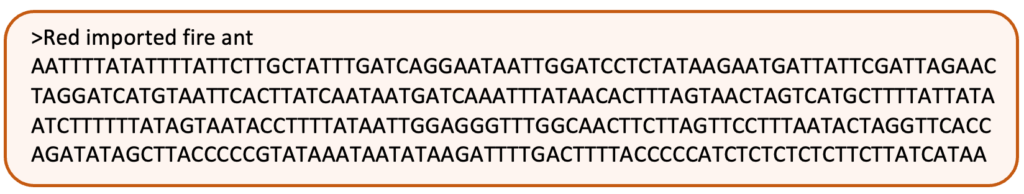
In bioinformatics, FASTA is a text-based format for representing either nucleotide (DNA/RNA) or amino acid (protein) sequences. The file must have a top line that begins with ‘>’ and include a sequence name and/or short description. The actual sequence comprises the rest of the file. For example:
- This file contains DNA sequence information for the red imported fire ant. The first line contains ‘>’ followed by the name of the sequence. A line break separates the name from the actual DNA sequence.
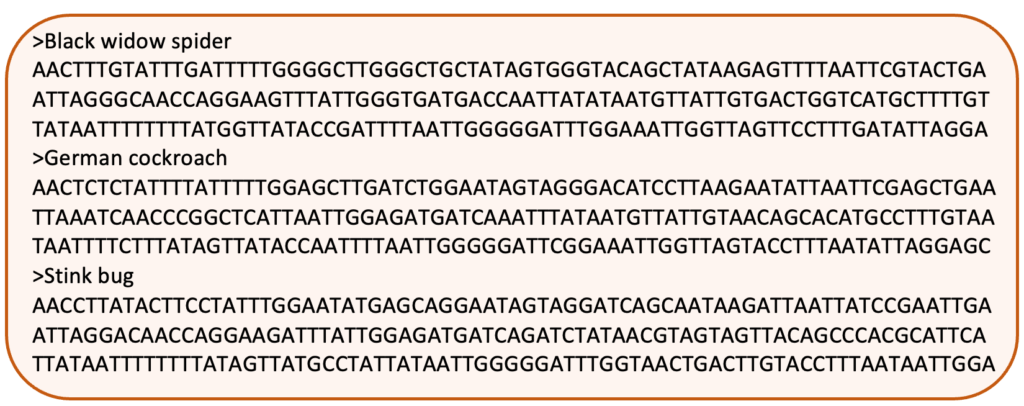
- This file contains three separate DNA sequences. The ‘>’ symbol designates the beginning of a new sequence within a FASTA file. Names, or descriptors, are located on the top line, followed by a line break and the corresponding DNA sequence.
FASTA File Name
Just as PDF documents are identified with a .pdf file extension, FASTA files use .fasta or .fa at the end of the file name.
Creating and Modifying a FASTA File
Any bioinformatics program (such as MEGA, SnapGene, or Geneious) can create and modify FASTA files. Alternatively, a FASTA file may be manually edited using a basic text editing program (i.e., TextEdit for Mac or Notepad for PC). Text can be added and deleted as long as it retains the FASTA format (above).
PRE-LAB ACTIVITY

LAB GUIDES
DNA SEQUENCES
Introduction to Bioinformatics
Example DNA Chromatograms
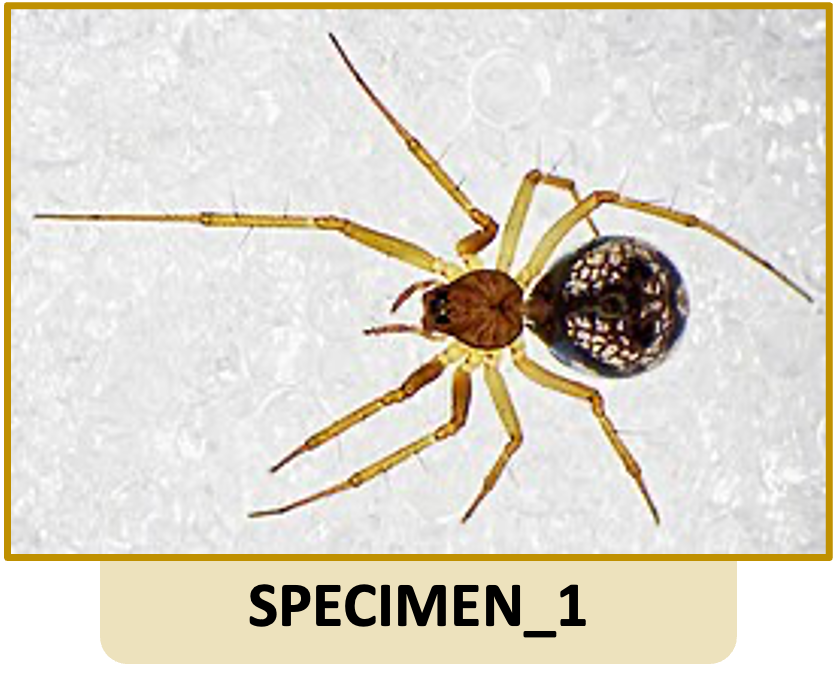
- SPECIMEN_1
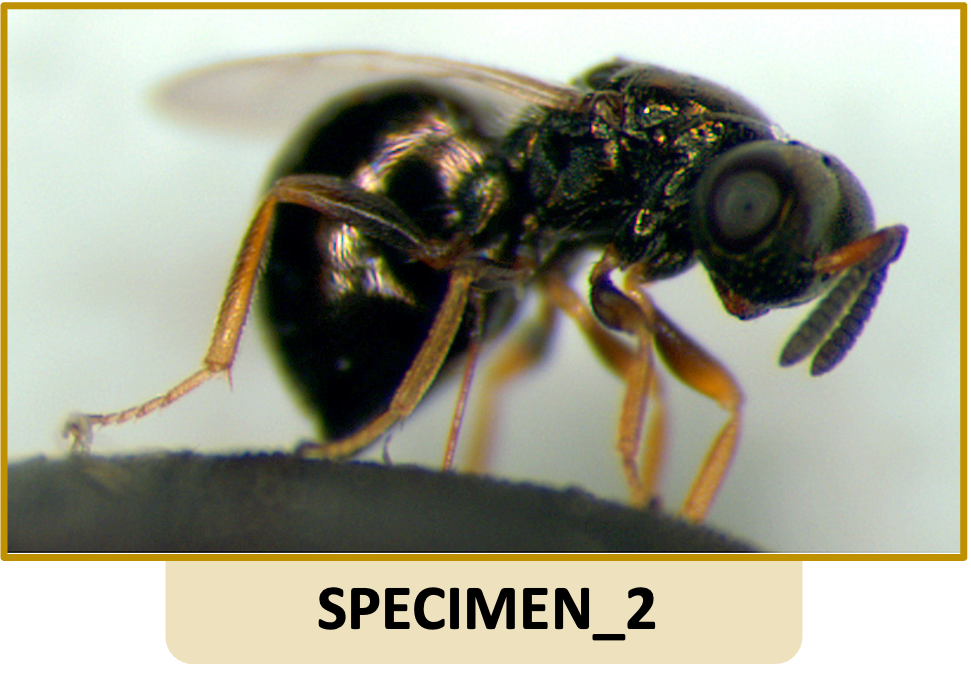
- SPECIMEN_2
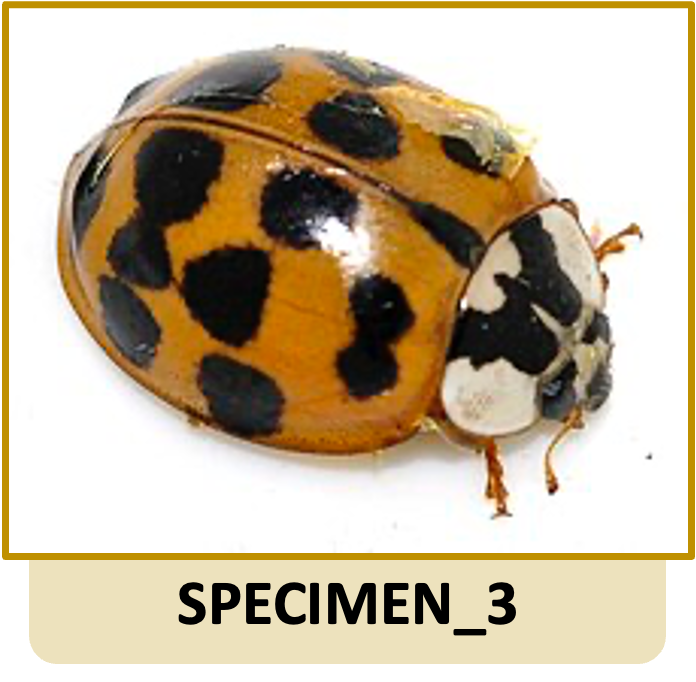
- SPECIMEN_3
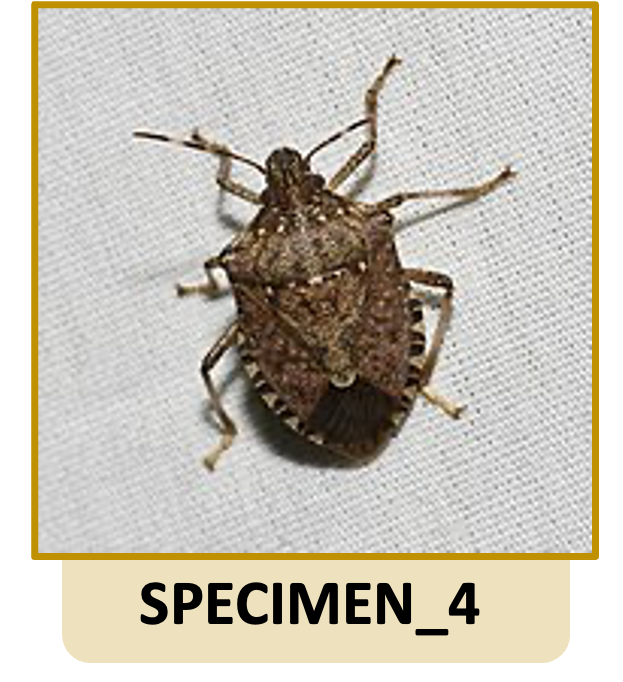
- SPECIMEN_4
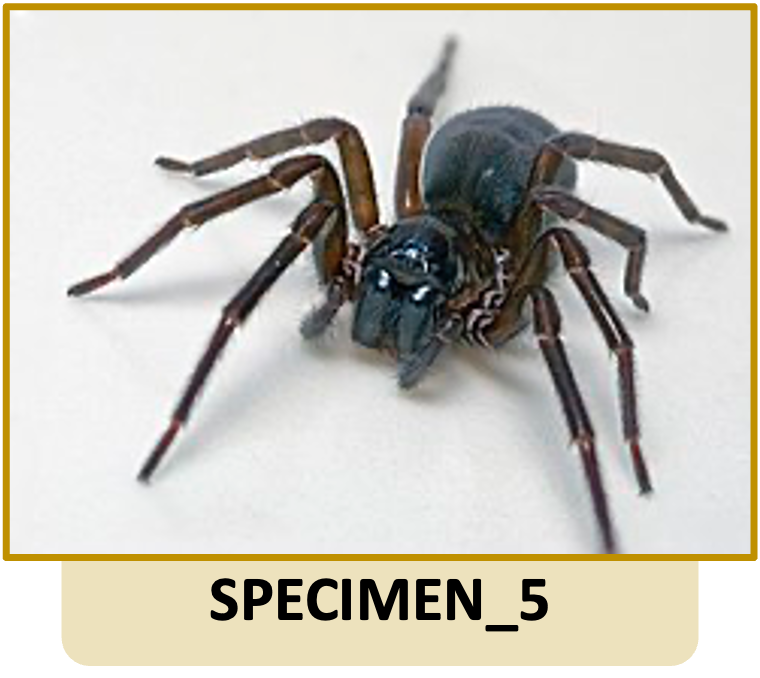
- SPECIMEN_5
- SPECIMEN_6
- SPECIMEN_7
- SPECIMEN_8
- SPECIMEN_9
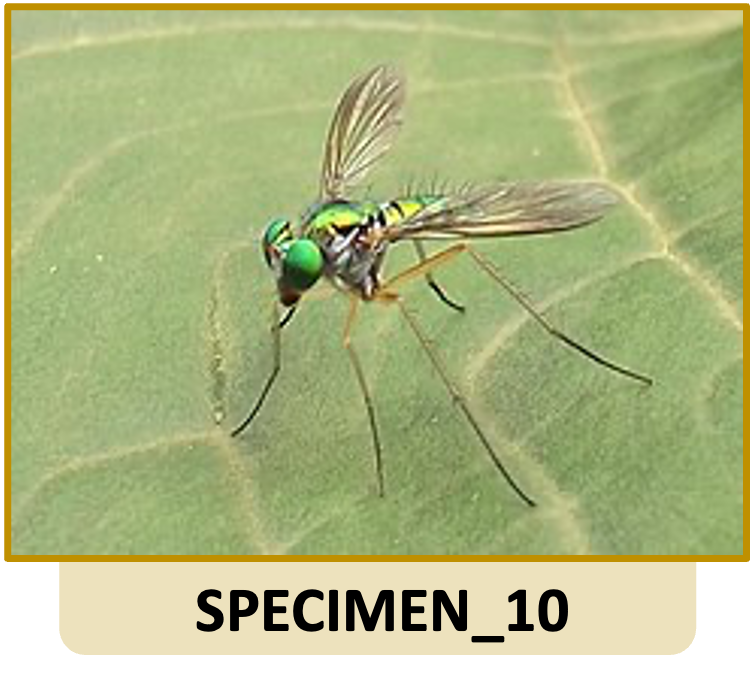
- SPECIMEN_10
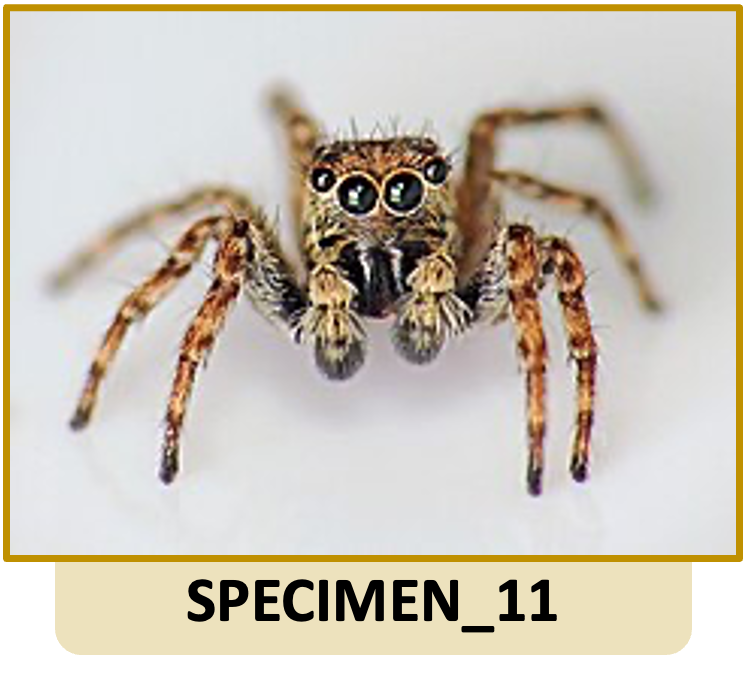
- SPECIMEN_11
Phylogeny (.fasta file)
FAQs